Xcode 7: Code Coverage
One of Xcode 7’s new features is measuring your application’s code coverage when running your unit tests. This article shows how to generate code coverage data and read code coverage statistics.
For those of you unfamiliar with code coverage, code coverage measures which lines of your application code execute when the application runs. Before shipping your application, your goal should be to cover as much of your code as you can to make sure there are no problems with the code. The ultimate goal is 100% coverage, but that may be not possible for your project. You can run multiple tests to achieve 100% code coverage as running 100% of your code in a single test run is difficult.
Turn on Code Coverage #
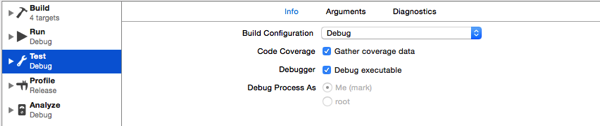
Initially code coverage is disabled. To turn on code coverage, open the scheme editor, select the Test step, and select the Gather coverage data checkbox.
Generate Code Coverage Data #
Choose Product > Test to run your unit tests and generate code coverage data.
After running the tests Xcode displays code coverage statistics on the right side of the source code editor for each function in your code.

If the function was exercised during the test, Xcode highlights the block in gray and shows the number of times it was exercised. The screenshot shows statistics for three functions. The first function was exercised once, and the third function was exercised three times. If a function was not exercised during the test, Xcode highlights the block in red. The second function in the screenshot was not exercised so Xcode displays a 0 on the right side of the editor.
Choose Editor > Hide Code Coverage to hide the code coverage data in the editor. Choose Editor > Show Code Coverage to see the code coverage data.
View Your Project’s Code Coverage #
Use Xcode’s report navigator to view a report summarizing your project’s code coverage. Open the report navigator by choosing View > Navigators > Show Report Navigator or by clicking the rightmost button at the top of the navigator area. Select your test from the report navigator to view test data in Xcode’s editor. Click the Coverage button at the top of the editor to view a code coverage report.
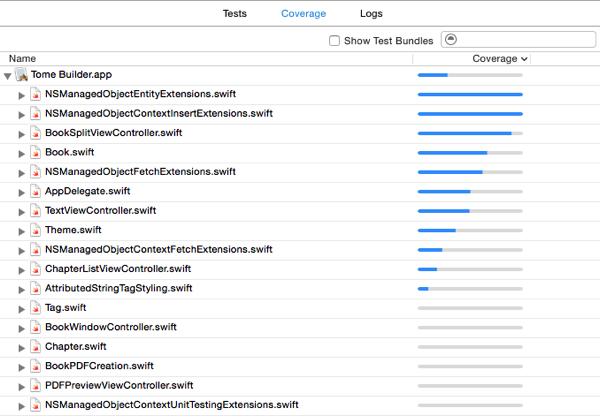
At the top of the code coverage report is the name of your application and a progress bar showing the percentage of code coverage for the project. The amount of blue in the progress bar represents the percentage of code that was exercised during the test. If you look at the screenshot of the report, you can see the project I tested has low code coverage. About 20% of the application code was exercised during this test.
Below the application name is a list of each source code file in your project and a progress bar measuring the percentage of code coverage of that file. In the screenshot of the code coverage report, the first two files have 100% code coverage, and the last six files have no code coverage.
Next to each file is a disclosure triangle. Click the disclosure triangle to see each function in the file along with its code coverage percentage.
If you select the Show Test Bundles checkbox, Xcode will show code coverage percentages for your unit test classes.