Instruments Source View
Instruments 2, which ships with Xcode 3.2, added a source view that lets you examine your source code inside Instruments. When you combine the source view with the extended detail view, finding the problem areas in your code becomes easier.
Switching to the Source View #
At the bottom of the trace document window is a collection of six buttons.
If you see only four buttons, you’re most likely running Leopard and Instruments 1. Instruments 2 requires Snow Leopard. The buttons from left to right are:
- Table view
- Outline view
- Diagram view
- Console
- Source view
- Extended detail view
The source view looks similar to an Xcode editor window. Click the source view button to switch to the source view.
I’ll briefly explain the other views for those of you new to Instruments. The table, outline, and diagram views provide different views of the trace data. The table view shows the data in a flat list. The outline view shows the data in a hierarchical list, and the diagram view shows the data as a list of individual samples. Most instruments do not use the diagram view.
The console is similar to Xcode’s debugger console. If your application uses NSLog or printf to log debugging information, the logged output appears in the console when you trace the application in Instruments.
For most instruments the extended detail view shows the call stack. The extended detail view is initially invisible. To take full advantage of the source view, open the extended detail view. The extended detail view resides on the right side of the trace document window.
Viewing Source Code #
When you first open the source view, it displays the following message:
Drop Source File to Analyze
Drag one of your source code files to the source view to examine it in the source view.
There is a second way to view source code. Make sure the extended detail view is open. Switch to the table, outline, or diagram view. Select a trace sample and examine the call stack in the extended detail view. Find a function you wrote on the call stack and double-click it. If there is no function you wrote on the call stack, select another trace sample.
When you double-click a function you wrote, something cool happens. Instruments switches to the source view and displays the function you double-clicked. It also highlights the code with a message bubble that looks similar to the message bubbles Xcode shows when you have a compiler error or warning. The exact contents depend on the instrument, but the following is an example from the ObjectAlloc instrument:
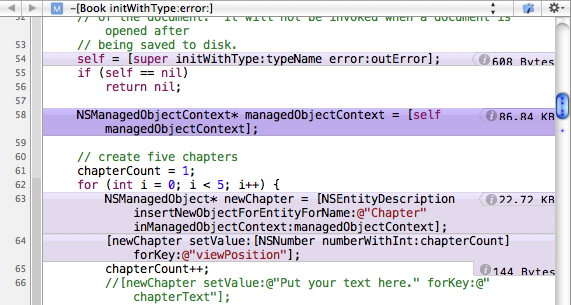
Each line of code that allocates memory is highlighted. The amount of memory allocated by that line of code appears on the right.
The Leaks instrument highlights every line of code that leaks memory and tells you the total amount of leaked memory. The Time Profile and Sampler instruments tell you the number of samples recorded for a line of code.
If you look at the screenshot, you’ll notice an information button next to the amount of allocated memory. Clicking the information button shows you the five heaviest backtraces. For the ObjectAlloc instrument, the heaviest backtraces are the largest memory allocations. For the Leaks instrument, the heaviest backtraces are the largest memory leaks.